MatplotlibのFigureクラス、Axisクラスについて、混乱してしまう。まとめてみた(Figure、Axisインスタンスを使わない場合は、plt.plot()を使用)
import matplotlib.pyplot as plt
%matplotlib inline
# plt.igure()インスタンスを作り、figオブジェクトとする
fig=plt.figure()
# (2,2,1)にて初期化したfig.add_subplot()インスタンスを作り、axオブジェクトとする
ax=fig.add_subplot(2,2,1)
import numpy as np
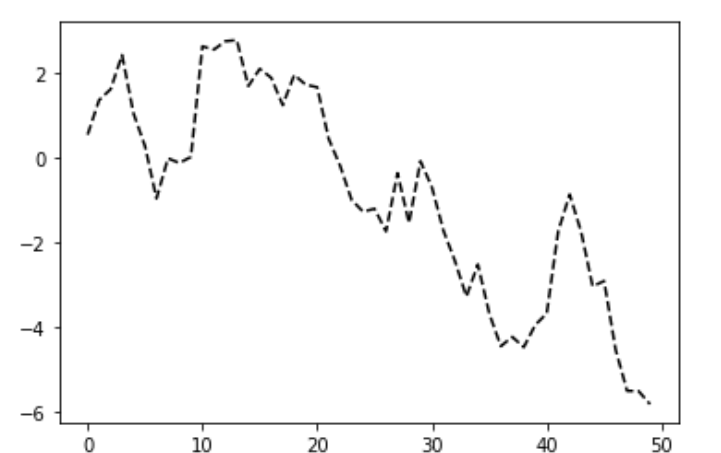
plt.plot(np.random.randn(50).cumsum(),'k--')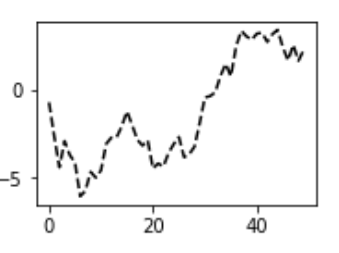
fig=plt.figure()
ax=plt.subplot(2,2,1)
plt.plot(np.random.randn(50).cumsum(),'k--')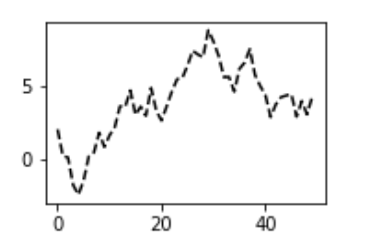
# 上記、fig=plt.figure()がなくても良い。
ax=plt.subplot(2,2,1)
plt.plot(np.random.randn(50).cumsum(),'k--') 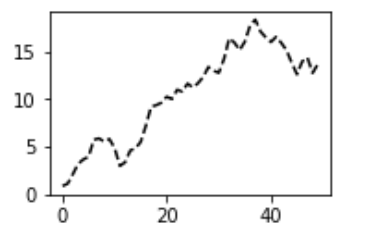
# FigureとAxesのインスタンスを同時に生成.
# a,b=1,2 と同様、それぞれのオブジェクトに値が入る
fig, ax = plt.subplots(1,1)
plt.plot(np.random.randn(50).cumsum(),'k--')