
import pandas as pd
import matplotlib.pyplot as plt
plt.rcParams['font.family'] = 'IPAPGothic'

df=pd.DataFrame([709.9,670.3,641.3,610.7,576.4,537.3,504.8],/
index=[2015,2016,2017,2018,2019,2020,2021],/
columns=['朝日新聞発行部数'])

df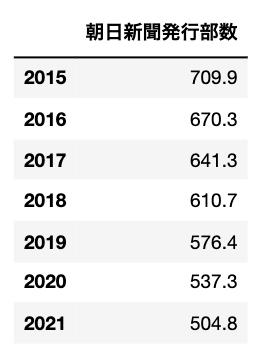
fig=plt.figure(figsize=(10,3))
ax=fig.subplots()
ax.plot(df)
plt.ylim([0,1000]) #y軸の目盛りの範囲の指定
plt.show()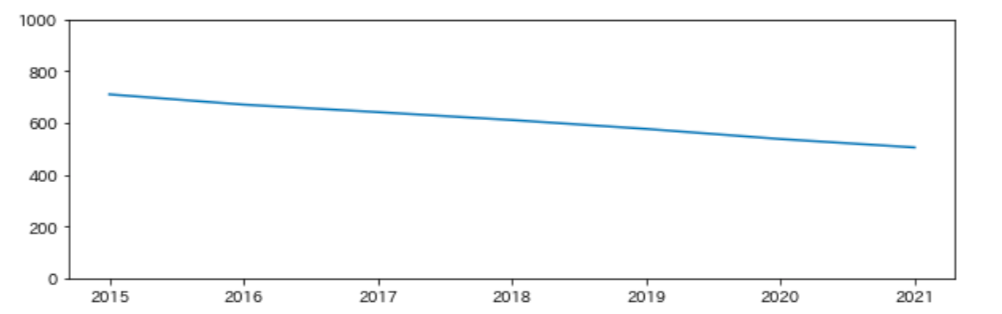
df=[709.9,670.3,641.3,610.7,576.4,537.3,504.8]
# indexをひとつズラして引き、その総和を求める
a=sum([ a - b for a, b in zip(df[1:7],df)])
b=len(df)
c=a/b
print('2015〜2021年の間、朝日新聞の発行部数は平均',c,'減少している')

#
2015〜2021年の間、
朝日新聞の発行部数は平均
-29.299999999999994 減少している