対数を描いてみる。
pythonのグラフを描くライブラリーであるmatplotlibには、logオブジェクトが用意されている。
それを使ってみた。がしかし、底の引数には2と10しか使えないようだ。
底の数を幅広く使えるようにするには、かんたんな関数を入れてみると、オッケーだったりする〜
/* python */
import numpy as np
import matplotlib.pyplot as plt
def logarithm(x,base):
return np.log(x)/np.log(base) //底の変換公式を使う
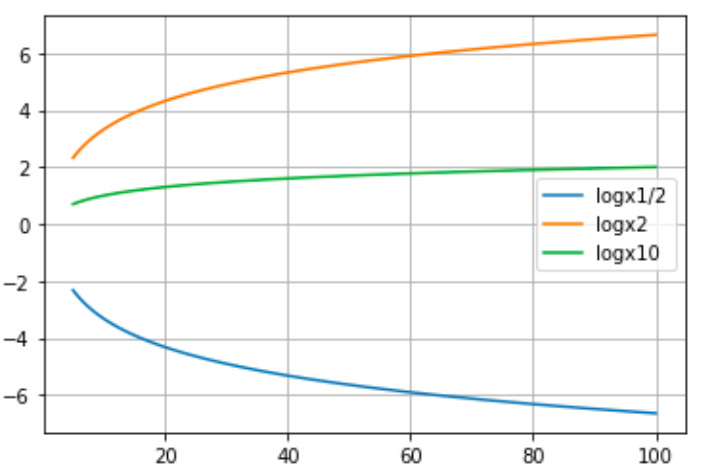
x= np.arange(5,100,0.01)
y05=logarithm(x,1/2)
y2=logarithm(x,2)
y10=logarithm(x,10)
p1,=plt.plot(x,y05)
p2,=plt.plot(x,y2)
p3,=plt.plot(x,y10)
plt.legend([p1,p2,p3],["logx1/2","logx2","logx10"])
//対数の名前を明示する
plt.grid() //グリッドを付ける
plt.show()