Pythonでのグラフの描写にはmatplotlibが利用される。
4つの方法がある。けれど、どれもplotという文字を含んでいて、とても、まぎらわしい。
ここで、整理してみよう。
- plt.plot
- plt.subplot
- add_subplot
- subplots
前者2つの、plt.plotとplt.subplotは関数で、
一方、後者2つのadd_subplotとsubplotsはクラスである。
こちらは、任意の値(グラフの下地となるスペースの大きさ、グラフの数)を入れたインスタンスをつくる。
じっさいに、コードを書いていこう。
import numpy as np
import matplotlib.pyplot as plt

x=np.arange(-1,1,0.01)
y=x**2

# plt.plot
plt.plot(x,y)
plt.show()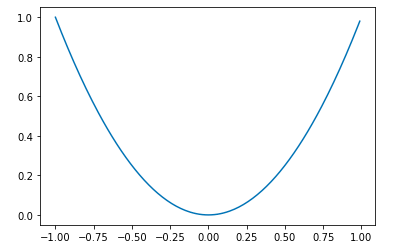
#plt.subplot
plt.subplot(2,2,1)
plt.plot(x,y)

plt.subplot(2,2,4)
plt.plot(x,y)

plt.show()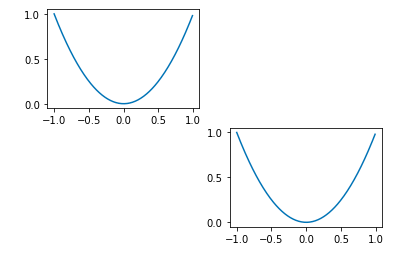
#add_subplot
fig = plt.figure(figsize=(8,6))
ax1=fig.add_subplot(221)
ax1.plot(x,y)

ax2=fig.add_subplot(224)
ax2.plot(x,y)

plt.show()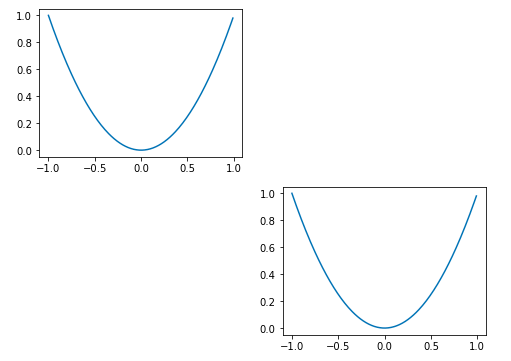
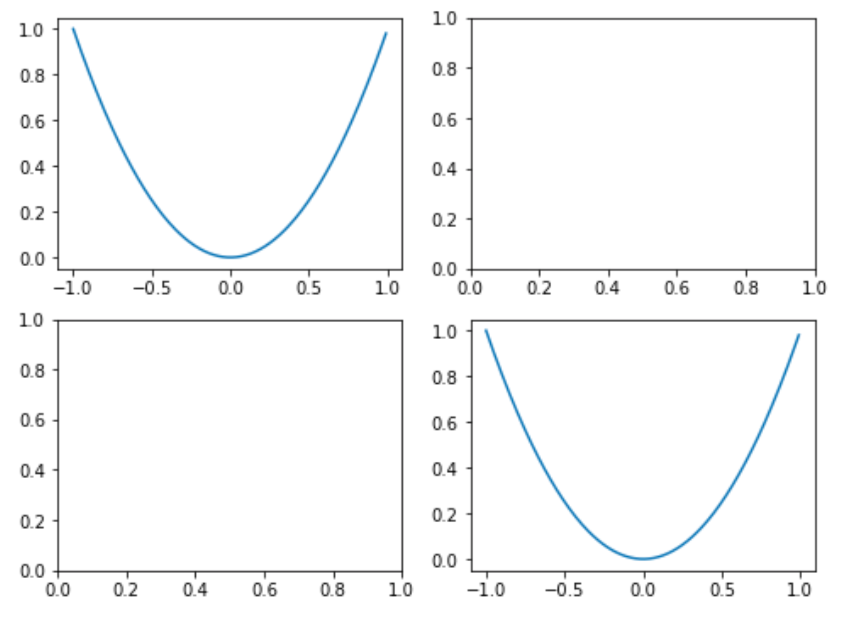
fig,ax=plt.subplots(2,2,figsize=(8,6))
ax[0,0].plot(x,y)

ax[1,1].plot(x,y)
plt.show()